
UNDERSTANDING HVLS FAN SPECIFICATIONS
Specifying HVLS fans for a given space is not hard. However, we have seen wrong fans being recommended at times by various manufacturers because of the lack of understanding of the basic concepts.
Let us look at the following critical factors for HVLS fans of about 1hp rating or more (>750W).
Diameter of the fan;
Coverage area;
Optimum distance from the ceiling (X);
Optimum distance from the floor (Y);
Optimum distance from the wall (Z).
If we understand these five parameters, we can specify a correct fan and provide correct information to the end customer about the air flow.
LAMINAR AIR FLOW
These guidelines ensure a laminar air flow. A laminar airflow allows for the most efficient use of the HVLS fans. If these guidelines are not followed, the air flow becomes restrictive, non-laminar or turbulent resulting in loss of energy and air flow. For example if parameters such as X is made too small, an HVLS fan may not be able to suck in sufficient air to convert into an air flow.
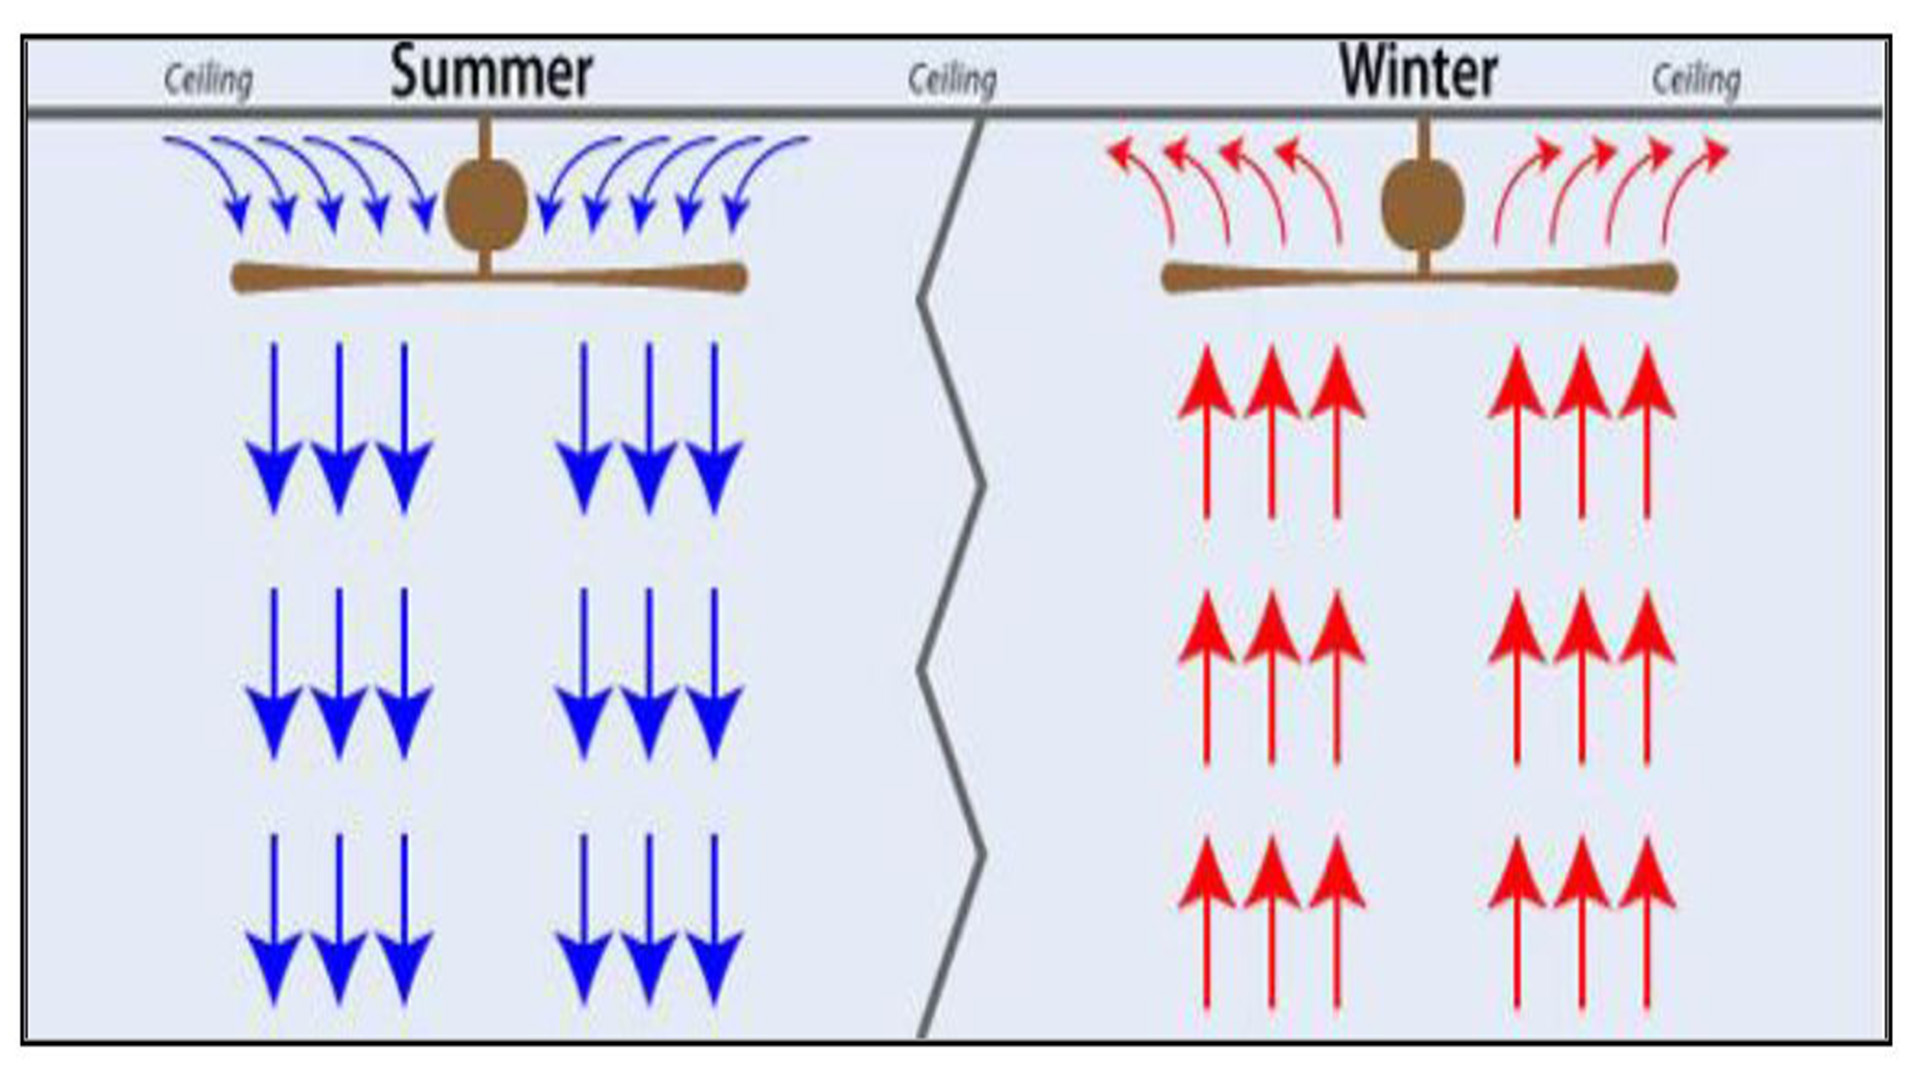
Figure 1: Example of a Smooth Laminar Airflow
Similarly if parameters Y or Z are too large or small, it will either result in lack of airflow or the air flow becomes restrictive, non-laminar or turbulent resulting in loss of energy and air flow. Let us look at few more important rules.
The fan speed is NOT indicative of airflow. However, air flow is directly proportional to the input power of the motor. The reason we talk about the input power is because that can be measured directly by the end user. Output power of the motor and air flow are more difficult to measure. In most cases, CFD (Computation fluid dynamics) is not necessary unless we are dealing with complex spaces with odd dimensions and several barriers to air flow.
Table 1: Epoch Industrial Fans table of fan diameters with speed, power and coverage area
Diameter of the Fan (ft) | Speed (RPM) | Power (W) | Max Coverage Area (Sq. Ft.) A | Optimum Distance from the Ceiling (ft) X | Optimum Distance from the Floor (ft) Y | Optimum Distance from the Wall to the fan center (ft) Z |
6 | 230 | 650 | 4000 | 2 | 9 | 9 |
8 | 190 | 860 | 5000 | 2 | 12 | 12 |
10 | 160 | 1000 | 6000 | 2 | 15 | 15 |
12 | 130 | 700 | 7000 | 3 | 18 | 18 |
14 | 120 | 1150 | 8000 | 3 | 21 | 21 |
16 | 95 | 1060 | 12000 | 4 | 24 | 24 |
18 | 75 | 900 | 15000 | 4 | 27 | 27 |
20 | 60 | 720 | 18000 | 5 | 30 | 30 |
22 | 55 | 680 | 23000 | 5 | 33 | 33 |
24 | 62 | 1200 | 30000 | 5 | 36 | 36 |
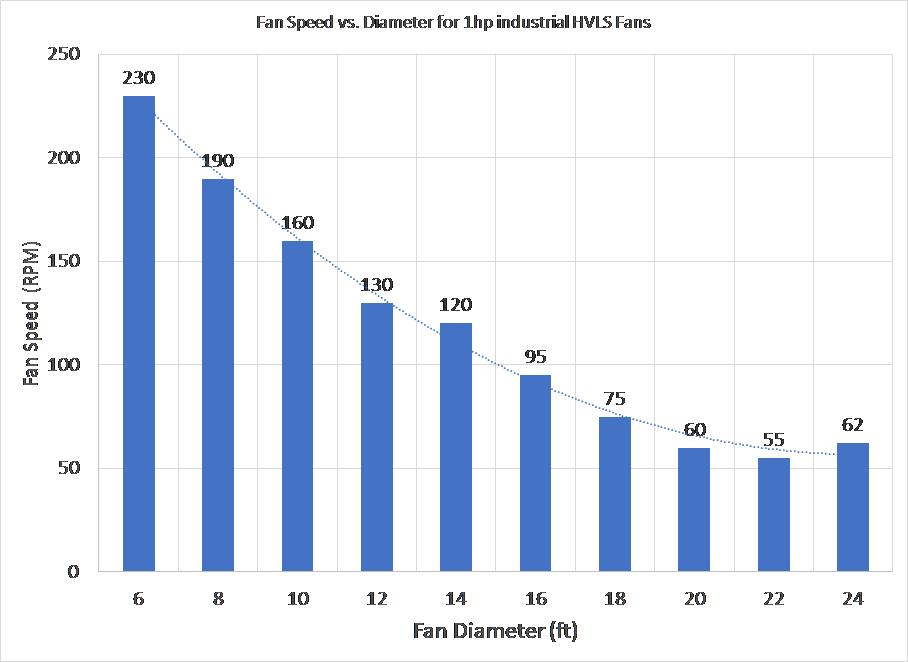 Figure 2: Fan speed vs. Fan Diameter of Industrial HVLS Fans
FAN SPEED:

Fan speed is reduced progressively for each fan diameter. This is done to increase the coverage area without increasing the power consumption significantly. However, fan speed is not an indicator of air flow if you wish to compare among different competitors. In fact, a company X can have light blades, higher speed and still very poor air flow as compared to company Y who has lower speed and twice the air flow.
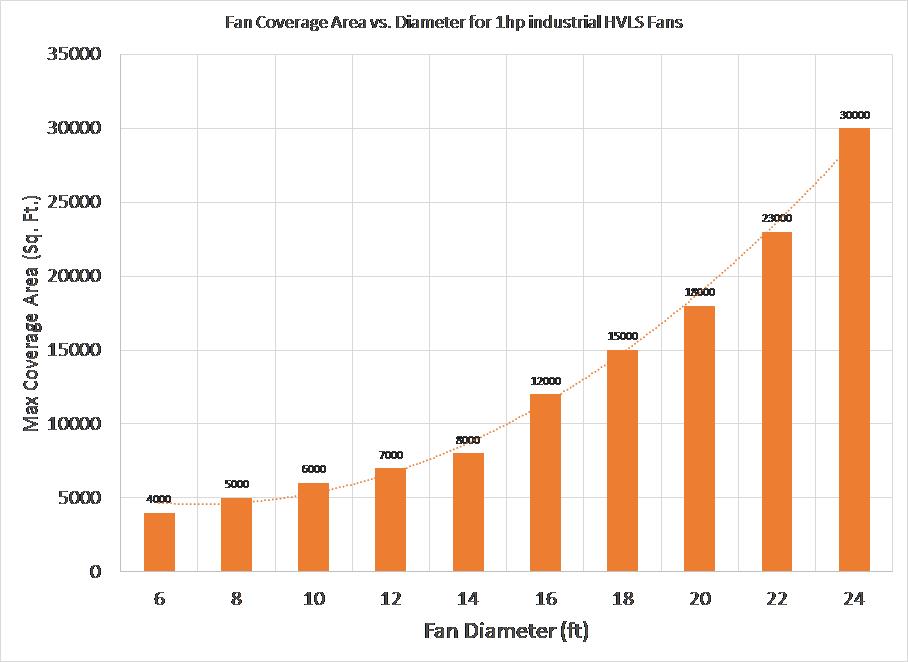
Figure 3: Max Coverage Area vs. Fan Diameter of Industrial HVLS Fans
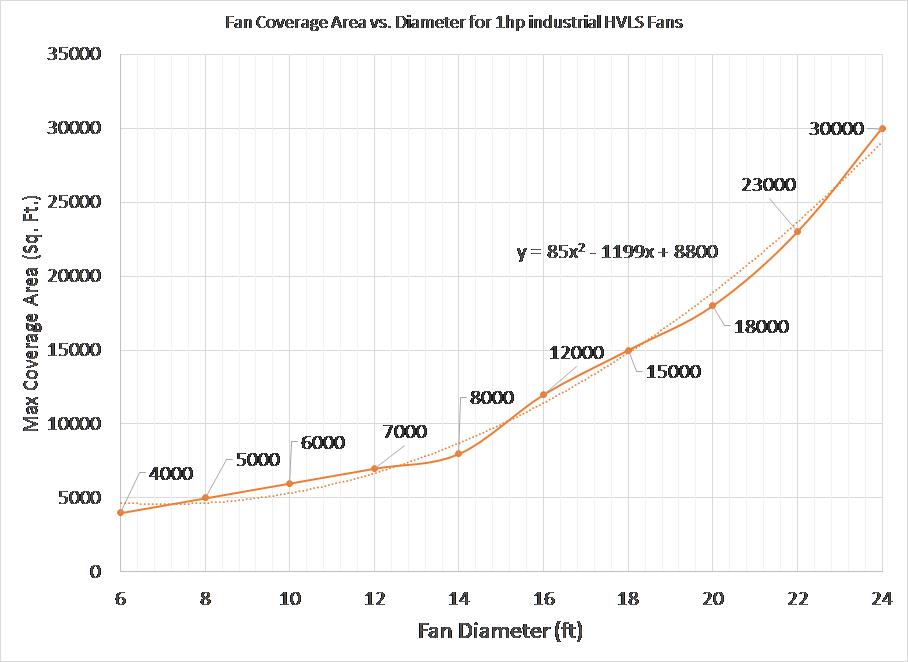 Figure 4: Max Coverage Area vs. Fan Diameter can be approximated with a quadratic equation
MAX COVERAGE AREA:
As fan diameter is increased, max coverage area is increased as shown in Figure 2 above. However, what does that really mean? It simply means that air flow can go to farther distance, however, at a slower speed. Going from a 16-ft fan to 24-ft fan increases the coverage area but at the expense of reduced air flow speed at the boundaries when the power of the fan is kept constant. We can not generate more air flow speed out of nothing. Simple change of blades simply helps to spread the air particles farther.
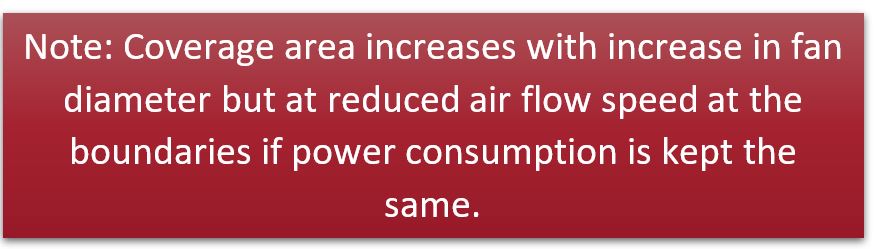
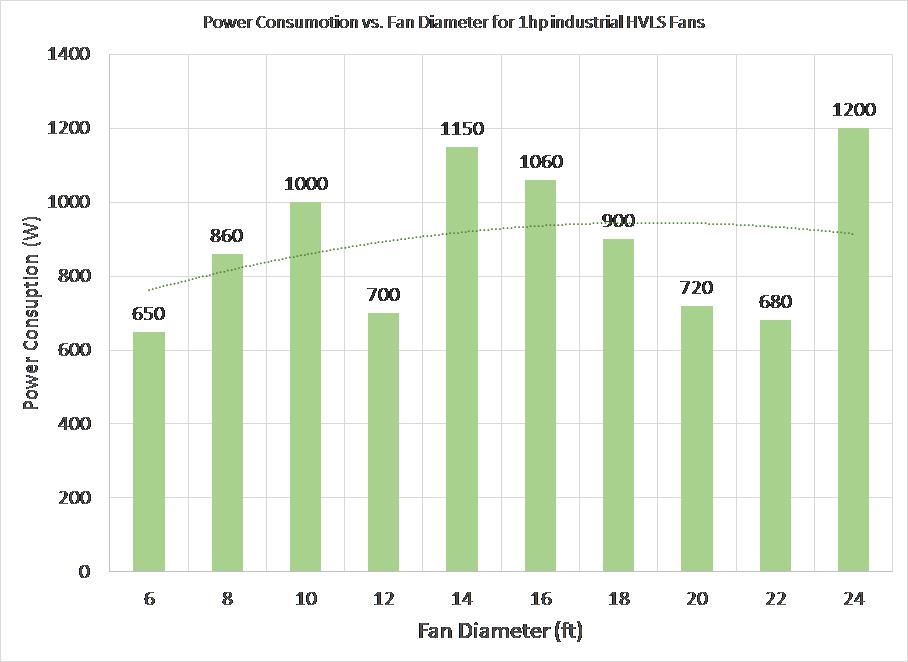
Figure 5: Power Consumption vs. Fan diameter of Industrial HVLS fans
POWER CONSUMPTION:
Power consumption is a critical indicator of air flow. It can be easily measured by anyone and used to compare different fans. Manufacturers do not list the real power consumption on their data sheet. Hence an actual measurement is required. If you see figure 5above, 24-ft fan produces twice as much air flow as the 12-ft fan (1200W vs. 650W).

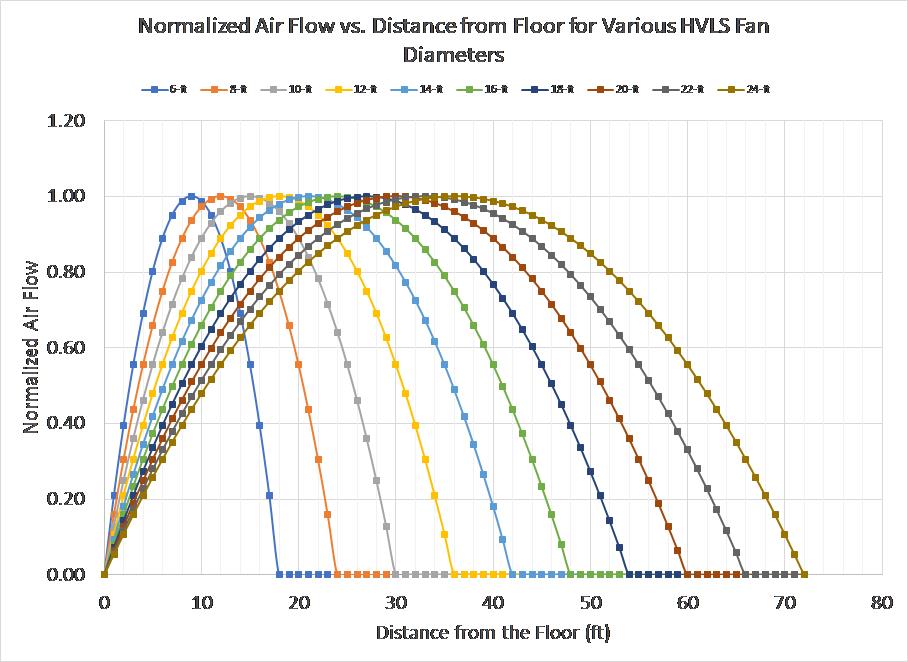 Figure 6:Normalized air flow vs. fan distance from the floor. 6-ft fan has the shortest distance and airflow coverage.
DISTANCE FROM THE FLOOR:

This is one of the critical factors to examine before specifying HVLS fans. If you specify a fan and the appropriate distance does not exist, the air flow will not materialize. Why is that? At shorter distances, air particles will collide with each other causing loss of laminar flow and hence lack of air flow. At larger distances, air particles will not reach the floor with required air velocity again causing loss of air flow.
The phenomenon can be understood in the figure 4 shown above and figure 5 below. For example, 6-ft fan diameter will produce optimum air flow at 9 ft from the floor. Air flow is 0 at 18-ft and reduced proportionally when distance is decreased or increased from 9 ft. Similarly, for 24-ft fan diameter, optimum air flow occurs at 36-ft and proportionally reduces when increased beyond 36-ft or reduced below 36-ft.
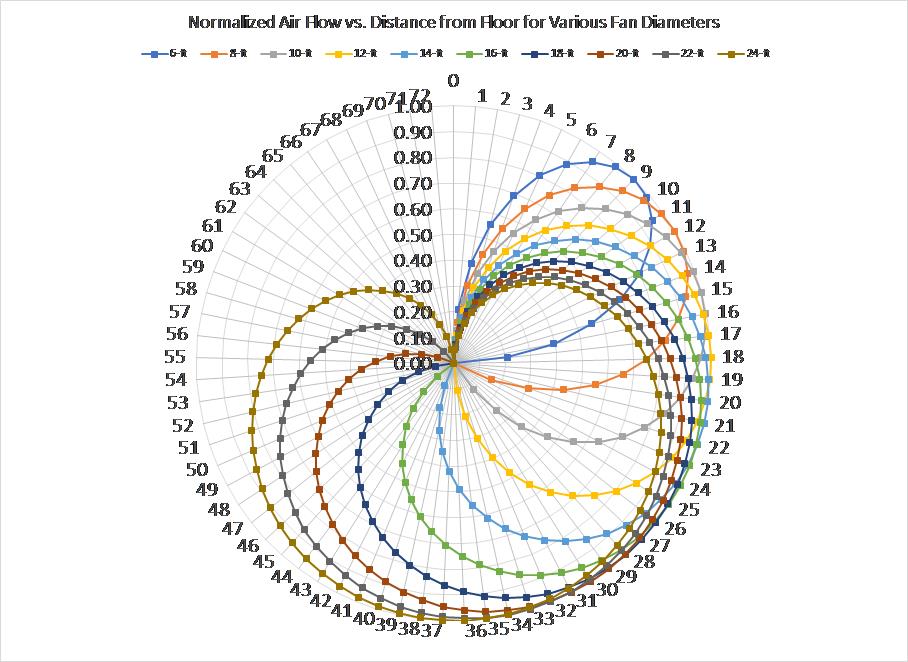
Figure 7: Normalized air flow vs. fan distance from the floor (radar graph)
APPLICATION OF THE RULES:
Following are some of the quick thumb rules which can be used to specify an HVLS fan.
Step 1: Measure the distance between the ceiling and the floor.
Step 2: Measure wall to wall distance on all sides.
Step 3: Subtract the distance X from table 1 for all fan values. You will get 10 new values.
Step 4: Divide numbers obtained in step 2 by 2 and then by 1.5. Take a minimum of these numbers. Let us say d1.
Step 5: Divide numbers obtained in step 3 by 1.5. Subtract these numbers from the fan diameter. Take a minimum of these numbers. Let us say e. Select the fan diameter for which e is the lowest. Let us say d2.
Step 6: Measure the area to be covered. Let us say A1. Use the equation in figure 3 to obtain d3.
Step 7: Now you have 3 possible solutions, d1, d2 and d3. Evaluate each of the solutions and the final solution must meet A, X, Y and Z parameters of table 1 to proximity.